Using the debugger
PureBasic provides a powerful debugger that helps you find mistakes and bugs in your
source code. It lets you control the program execution, watch your variables,
arrays or lists or display
debug output of your programs. It also provides advanced
features for assembly programmer to examine and modify the CPU registers or view the
program stack, or the Memory of your program. It also provides the possibility to debug a program remotely
over the network.
To enable the debugger for your program, you can select "Use Debugger" from the debugger
menu, or set it in your programs Compiler options. By using the "Compile with Debugger"
command from the Compiler menu, you can enable the debugger for just one compilation.
You can directly use debugger commands in your source, such
as CallDebugger, Debug, DebugLevel, DisableDebugger and
EnableDebugger.
The PureBasic debugger comes in 3 forms:
A Debugger integrated directly with the IDE, for an easy to use, quick way to debug
your programs directly from the programming environment. This debugger also
provides the most features.
A separate, standalone debugger, that is useful for some special purposes (for example,
when the same program must be executed and debugged several times at once) or to be used
with third party code Editors. It provides most of the features of the integrated IDE debugger,
but because it is separate from the IDE, some of the efficiency of the direct access from the IDE is lost.
The standalone debugger can be used to debug programs remotely through a network connection.
A console only debugger. This debuggers primary use is for testing non-graphical
environment like on Linux systems without an X server, or to remotely develop through ssh.
The type of debugger that is used can be selected in the preferences.
All this debugging functionality however comes at a price. Running a program in debug mode is
significantly slower in its execution that running it without the debugger. This should be no problem
however, since this is for testing only anyway.
If you need to use the debugger, but have some parts in you program that require the full execution
speed, you can disable the debugger in just that section with the DisableDebugger /
EnableDebugger keywords.
The Debugger integrated into the IDE

You can access all the debugger features while the program is running from the debugger menu, or the
corresponding toolbar buttons or shortcuts.
While you are debugging your program, all the source files that belong to that program (also included files)
will be locked to read-only until the program has finished. This helps to ensure that the code
that is marked as the currently executed one is has not actually been modified already
without a recompilation.
Note that a program can be run only one time at once in IDE debugger mode. If you try to
executed it again, you are given the option to execute it with the standalone Debugger.
Tip:
The debugger menu is also added to the system-menu of the Main IDE window (the menu you
get when clicking the PB icon in the left/top of the window). This allows you to access
the debugger menu also from the Taskbar, by right-clicking on the Taskbar-Icon of the IDE.
Program Control
There are functions for basic control of the running program. You can halt
the execution to examine variables and the code position or let the code execute
line by line to follow the program flow. While the program is halted, the line that
is currently being executed is marked in your source code (with very light-blue
background color in the default colors).
The state of the program can be viewed in the IDE status bar, and in the Error log area.
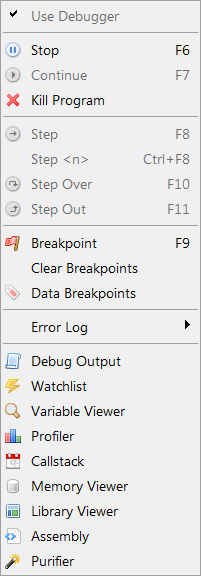
Menu commands for program control:
Stop
Halts the Program and displays the current line.
Continue
Continues the program execution until another stop condition is met.
Kill Program
This forces the program to end, and closes all associated debugger windows.
Step
This executes one line of source code and then stops the execution again.
Step <n>
This will execute a number of steps that you can specify and then stop the execution again.
Step Over
This will execute the current line in the source and then stop again, just like the normal 'Step'.
The difference is that if the current line contains calls to procedures, the execution will not
stop inside these procedures like it does with the normal 'Step', but it will execute the whole
procedure and stop after it returned. This allows to quickly skip procedures in step mode.
Step Out
This will execute the remaining code inside the current procedure and stop again after the procedure
has returned. If the current line is not in any procedure, a normal 'Step' will be done.
Line Breakpoints
Breakpoints are another way to control the execution of your program. With the
Breakpoint menu command, you mark the currently selected line as a breakpoint
(or remove any breakpoint that exists in that line).
When the execution of the code reaches that line, it will stop at this point.
Note that if you select a non-executable line (such as an empty line or a Structure definition),
it will halt the execution on the next executable line after that.
After the execution of your program has stopped at a breakpoint, you can use any
of the Program control commands to continue/end the execution.
Breakpoints can be set and removed dynamically, while your program is running,
or while you are editing your source code. With the "Clear Breakpoints" command, you
can clear all breakpoints in a source file.
Note: You can also set/remove Breakpoints by holding down the Alt Key and clicking on
the border that contains the Breakpoint marks.
Data Breakpoints

In addition to the line specific breakpoints, the debugger also provides data breakpoints.
Data breakpoints halt the program if a given condition is met. This way it is easy to find
out when a variable or other value in the program changes and halt the program if that happens.
The condition can be any PureBasic expression that can be evaluated to true or false.
This can be anything that could be put after an If keyword, including logical operators
such as And, Or or Not. Most functions of the
Math, Memory and String
libraries as well as all object validation functions in the form IsXXX() and the XxxID functions
for getting the OS identifiers for an object are also available.
Example conditions:
  MyVariable$ <> "Hello" Or Counter < 0  ; halt if MyVariable$ changes from "Hello" or if the Counter falls below zero
  PeekL(*SomeAddress+500) <> 0           ; halt if the long value at the given memory location is not equal to zero
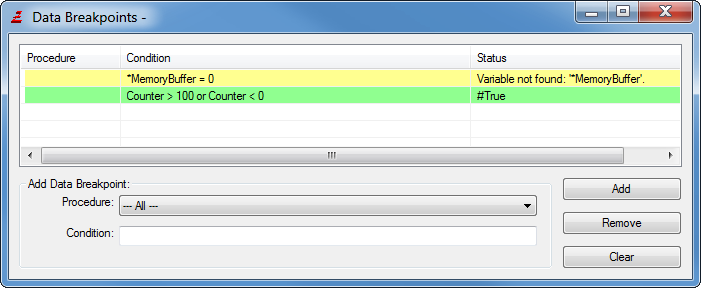
Data breakpoints can be added using the Data Breakpoint option from the Debugger menu.
They can be limited to a specific procedure or they can be added for all code. The special
"Main" entry of the procedure selection specifies that the data breakpoint should only
be checked when the execution is not in any procedure.
The status column shows the status of all breakpoint conditions on their last evaluation. This
can be true, false or an error if the condition is not a valid expression. Once a condition
is evaluated to true, the program execution will be halted. This condition is automatically
removed from the list as soon as the program continues, so that it does not halt the program
again immediately.
Note: Checking for data breakpoints slows down the program execution because the breakpoint
conditions have to be re-evaluated for every executed line of code to check if the condition is met.
So data breakpoints should only be added when needed to keep the program execution fast otherwise.
Limiting a data breakpoint to a certain procedure also increases the speed because the check then only
affects the given procedure and not the entire program.
Examining variables during runtime
The value of a variable can be very quickly viewed while the program is running by placing the
mouse cursor over a variable in the source code and waiting for a brief moment. If the variable is
currently in scope and can be displayed, its value will be shown as a tool-tip on the mouse location.

More complex expressions (for example array fields)
can be viewed by selecting them with the mouse and placing the mouse cursor over the selection.

The debugger tools also offer a number of ways to examine the content
of variables, arrays or lists.
Errors in the Program
If the debugger encounters an error in your program, it will halt the execution,
mark the line that contains the error (red background in the default colors) and
display the error-message in the error log and the status bar.
At this point, you can still examine the variables of your program, the callstack
or the memory, however other features like the Register display or stack trace are
not available after an error.
If the error is determined to be fatal (like an invalid memory access, or division
by 0), you are not allowed to continue the execution from this point. If the error
was reported by a PureBasic library, you are allowed to try to continue, but in many
cases, this may lead to further errors, as simply continuing just ignores the displayed error.
After an error (even fatal ones), you have to use the "Kill Program" command to end
the program and continue editing the source code. The reason why the program is not
automatically ended is that this would not allow to use the other debugger features
(like variable display) to find the cause of the error.
Note: you can configure the debugger to automatically kill the program on any error.
See Customizing the IDE for that.
Debugger warnings
In some cases the debugger cannot be sure whether a given parameter is actually an error
in the program or was specified like that on purpose. In such a case, the debugger issues a warning.
By default, a warning will be displayed with file and line number in the error log and the line will
be marked (orange in the default colors). This way the warnings do not go unnoticed, but they do
not interrupt the program flow.
There is also the option of either ignoring all warnings or treating all warnings like errors
(stopping the program). The handling of debugger warnings can be customized globally in the
Preferences or for the current compiled program in the
Compiler options.
The Error log
The error log is used to keep track of the compiler errors, as well as the messages
from the debugging. Messages are always logged for the file they concern, so when an
error happens in an included file, this file will be displayed,
and a message logged for it.
The "Error log" submenu of the Debugger menu provides functions for that:
Show error log
Shows / hides the log for the current source.
Clear log
Clears the log for this file.
Copy log
Copies the contents of the error log to the clipboard.
Clear Error marks
After you have killed the program, any error mark in the source file will remain.
This is to help you identify the line that caused the problem and solve it. The
"Clear error Marks" command can be used to remove these marks.
You can also configure the IDE to automatically clean the error marks when the
program ends. See Configuring the IDE for that.
The Standalone Debugger

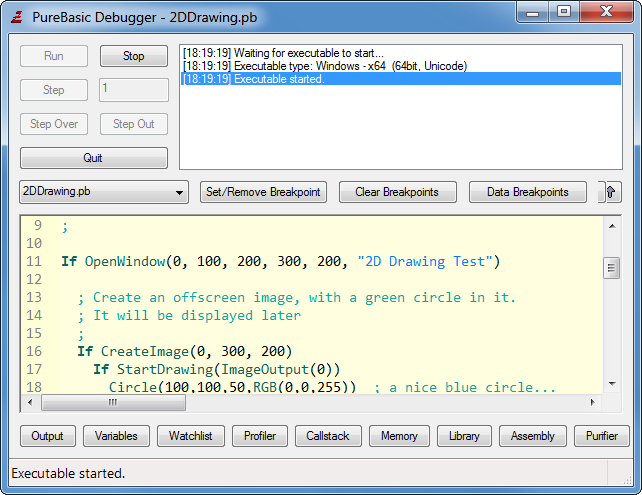
The standalone debugger is very similar to the one in the IDE, and will be explained here only briefly:
On the Debugger window, you have control buttons to carry out the basic program control,
as described above. The "Step" button carries out as many steps as are set in the edit
field next to it. Closing the Debugger with "Quit" or the close button will also
kill the debugged program.
The Error log area can be hidden by the up arrow button on the right side in order
to make the debugger window smaller.
The code view is used to display the currently executed code line as well as any errors
or breakpoints. Use the combo box above it to select the included file to view. The "Set Breakpoint",
"Remove Breakpoint" and "Clear Breakpoints" can be used to manage breakpoints in the
currently displayed source file. The code view also provides the mouse-over feature from the integrated
debugger to quickly view the content of a variable.
The debugger tools can be accessed from the buttons below the code area. Their usage is the same as with the
integrated IDE debugger.
Note: The Standalone Debugger has no configuration of its own. It will use the debugger settings and
coloring options from the IDE. So if you use a third-party Editor and the standalone debugger, you
should run the IDE at least once to customize the Debugger settings.
Executing the standalone debugger from the command-line:
To execute a program compiled on the command-line with enabled debugger (-d or /DEBUGGER switch),
call the debugger like this:
pbdebugger <executable file> <executable command-line>
If you execute a debugger-enabled executable from the command-line directly, it will only
use the command-line debugger.
Remote debugging with the standalone debugger:
The network debugging feature allows the easy debugging of programs on remote servers or inside
of virtual machines while still using a comfortable graphical interface instead of the command-line
debugger. The compilation of the program has to be handled separately either on the remote machine
or on the local machine before transferring the file to the target machine.
The debuggers between all operating systems and processor types supported by PureBasic are compatible
as long as the PureBasic version between the debugger and the compiler that compiled the program matches.
This means that a program running on Linux x64 can be debugged using an x86 Windows machine without problems for example.
The debugger and the compiled executable can both act as either the client or the server for the network
connection depending on the command-line parameters. One instance of the debugger can be used to debug one
program only. Multiple connections are not possible.
Running the debugger in network mode:
The following command-line parameters control the network capabilities of the standalone debugger.
  pbdebugger.exe /CONNECT=host[:port]  [/PASSWORD=password]
  pbdebugger.exe /LISTEN[=interface][:port]  [/PASSWORD=password]
The "connect" mode connects the debugger as a client to an executable which must have been started as a server before.
The "listen" mode creates a server and waits for an incoming connection from an executable.
If an the IP address of a local network interface is specified, the server will only listen on that specific interface.
Otherwise it will listen on all network interfaces for connections on the specified port.
If no port is specified, the default port (port 10101) is used.
The password option enables encryption on the debugger data stream using AES. If the client is started without the
password option but the server requires a password then you will be prompted to enter the password to establish a
connection.
Running the executable in network mode:
The executable has to be compiled in debugger mode as usual (using the /DEBUGGER or --debugger compiler switch).
It can then be started from the command-line with the following parameters to enable network mode.
The rules for client and server mode are the same as above.
  yourprogram.exe /DEBUGCONNECT=host[:port]  [/PASSWORD=password]
  yourprogram.exe /DEBUGLISTEN[=interface][:port]  [/PASSWORD=password]
If command-line parameters cannot be used to start the program in network mode (for example because the
program also reads its command-line parameters and would be confused by the debugger related options) there is
an alternative way by setting the following environment variable before executing the program (case sensitive):
  PB_DEBUGGER_Communication=NetworkClient;host[:port][;password]
  PB_DEBUGGER_Communication=NetworkServer[;interface][:port][;password]
Once the network connection is established between debugger and executable, the debugging session works in the same way
as local debugging. If the debugger is closed, the debugged executable is terminated as well. It is not possible to
disconnect or reconnect the debugger after the connection was established.
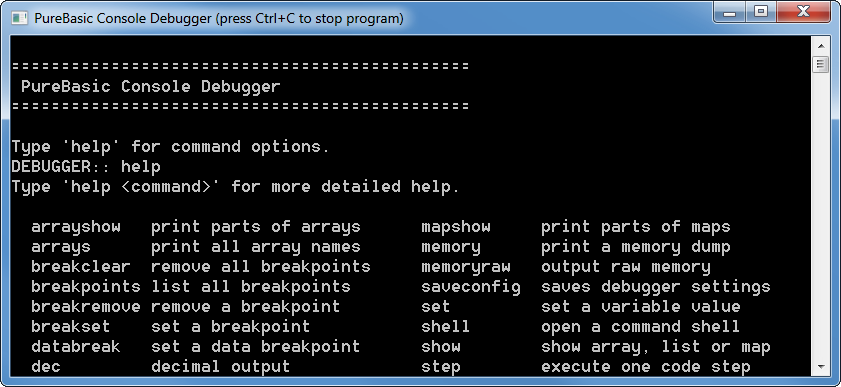
The command-line debugger:

The command-line debugger is not a part of the IDE and therefore not explained in detail here.
While the program is running, hit Ctrl+C in the console to open a debugger console prompt.
In this prompt type "help" to get an overview of all available commands.
Type "help <commandname>" for a more detailed description of the command.
Debugging threaded programs:
To use the debugger with a program that creates threads, the 'Create thread-safe executable' Option must be set in the
Compiler options, as otherwise the information displayed by the debugger concerning
line numbers, errors, local variables and such could be wrong due to the multiple threads.
The following features and limitations should be considered when debugging a threaded program:
While the program is running, the variable viewer, callstack display or assembly debugger will
display information on the main thread only. When the program is stopped, they display information
on the thread they were stopped in. So to examine local variables or the callstack of a thread,
the execution must be halted within that thread (by putting a breakpoint or a CallDebugger statement there).
The various 'Step' options always apply to the thread where the execution was last stopped in.
If an error occurs, the execution is halted within that thread, so any information displayed by the
variable viewer or callstack display is of the thread that caused the error.
The watchlist only watches local variables of the main thread, not those of any additional running threads.
While the execution is stopped within one thread, the execution of all other threads is suspended as well.
